Background:
The Umpqua River Basin is a major coastal fishery resource in Oregon and water temperature is a key management issue. Summer water temperatures in the lower part of the system frequently exceed 80 °F.
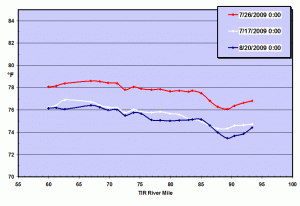
In the summer of 2002, Oregon DEQ contracted with Watershed Sciences, LLC of Corvallis to conduct airborne thermal infrared (TIR) remote sensing surveys in the Umpqua Basin. Umpqua TIR Report 2003 One of the outputs from this project was a profile of the surface temperature of the river thalweg based on samples from the TIR imagery.
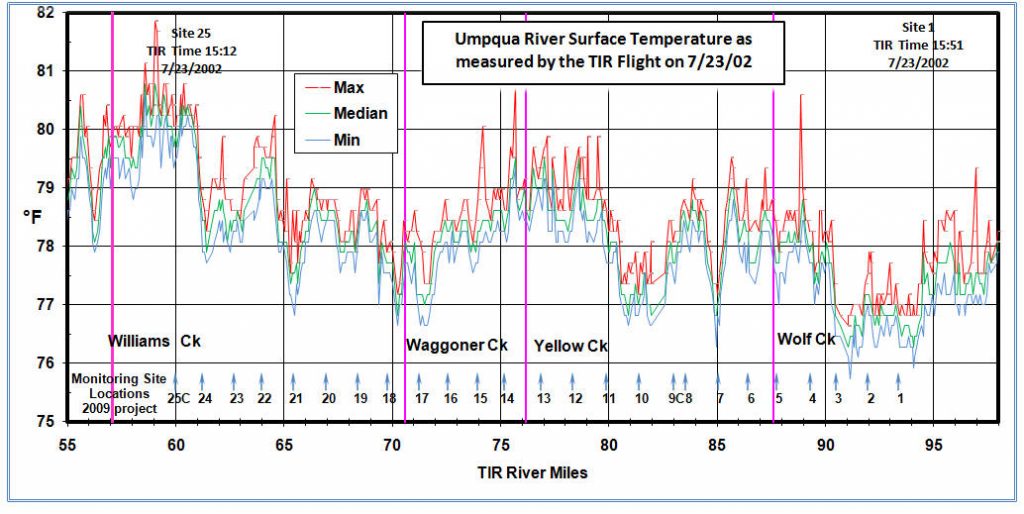
The chart shows the results of this sampling for a portion of the river. The variability of the data was of special interest since the low temperature areas could be associated with substantial cold-water inflow from the river bed that would be beneficial to the fishery resource.
2008 Work:
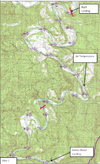
In 2008 the Partnership for the Umpqua Rivers Watershed Council (PUR) conducted water quality sampling on about 24 river miles between Mill Creek and Elkton. Intensive sampling of the river bottom did not show an indication of cold ground-water inflow sufficient to account for the “cool” zones in the TIR profile. This result indicated that more time-series data of the thalweg temperature was needed to fully characterize the longitudinal temperature profile of the river.
2009 Work:
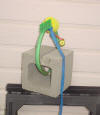
Site Photos
Click image to enlarge
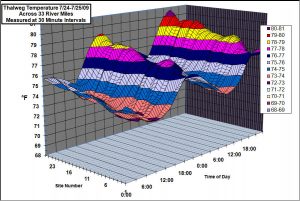
Temperature data was recorded at all of the sites at 30 minute intervals between 7/10-9/2/2010. The chart shows a 3D representation of the data for a two-day interval.
An animation of all the data for three 48-hour periods during the study can be viewed on the link.[View Movie Clip on YouTube]
General Comments:
1. The uneven response between sites over time suggests that the temperature response at each site is strongly influenced by local conditions.
2. The observed variability during the 15:00 time period appears to be consistent with the 2002 TIR data.
3. The median temperatures reported in the 2002 report were consistent with site-specific sampling completed for this study.
4. Based on our 2008 work, the variability is more likely driven by differences in response to solar loading rather than cold-water influences.
Site data (Appendix D) indicates a strong association between warmer reaches and exposed bedrock.
Ongoing work:
-
Characterize the effective influence zone for each site.
-
Attempt to correlate differences in solar input with the observed response. Data from the TIR imagery and geospatial radiation loading will be used.
-
Develop the cross-section data.
-
Compare response of the loggers between start time and end of study to test for embedded effects.
Acknowledgements:
This project was funded in part by an Oregon NPS Implementation 319 grant.
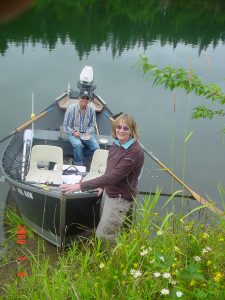
Thanks to Vince Fox, a master river boatman, who provided us with complete access to the river. Special thanks also goes to Sandy Lyon of the PUR Watershed Council for her encouragement and support. She made this project possible.
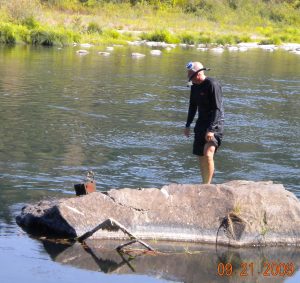
Obtaining synoptic temperature data from the thalweg of a large river is problematic to say the least. We are grateful for the assistance of Alan Bunce who enabled the retrieval of the concrete blocks by snorkel diving in swift current to depths exceeding 20 feet.
